office (808) 329-1627
DataManager Wind Rose Screen
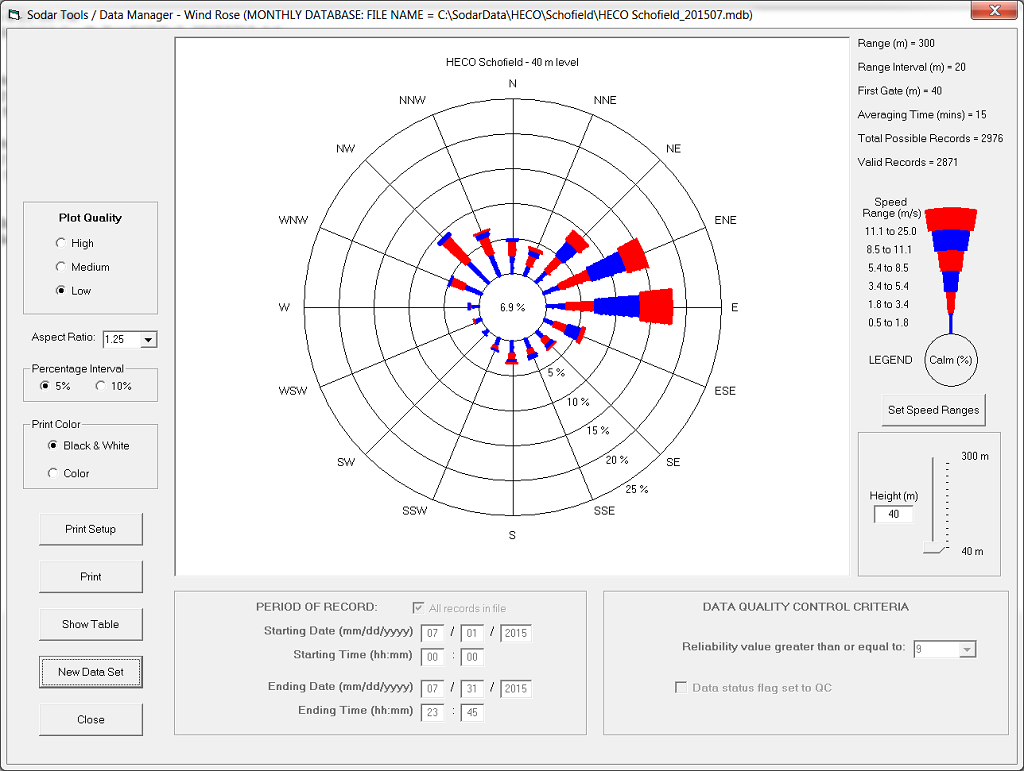
An example of the DataManager Wind Rose Screen is shown below. This function gives the user the capability to plot a wind rose of the sodar wind data for a selected period. The height is selectable and so are the speed ranges for each category. A button is provided to display the underlying data table, which shows the actual percentages used to generate the plot.