office (808) 329-1627
DataManager Weibull Plot Display
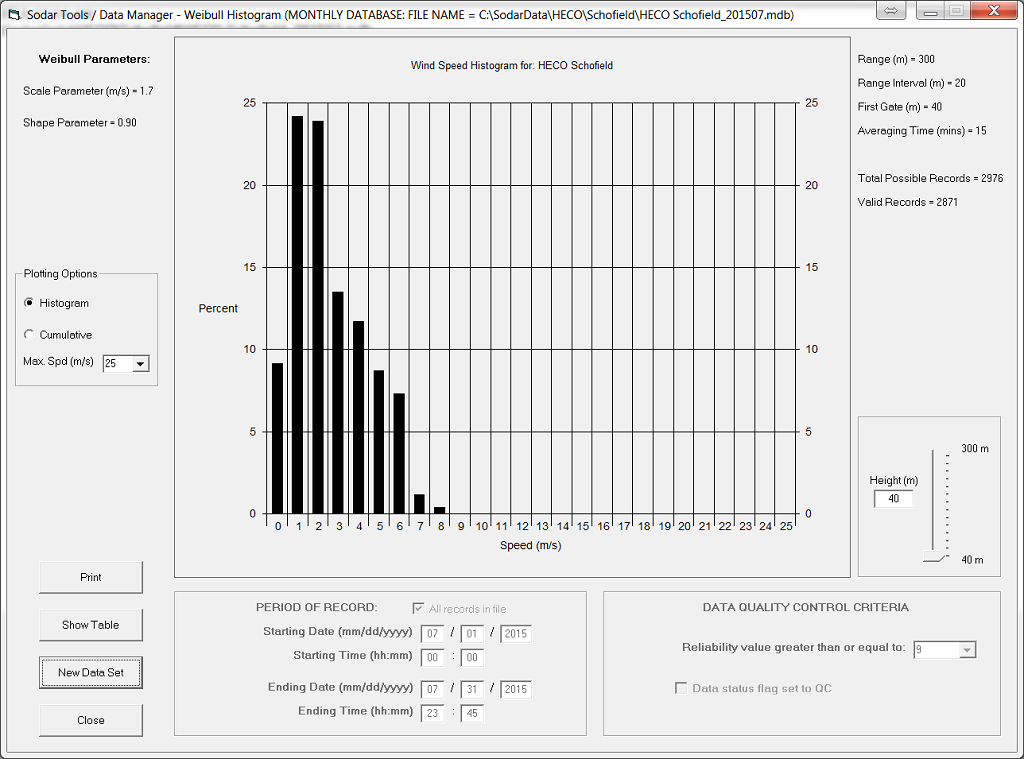
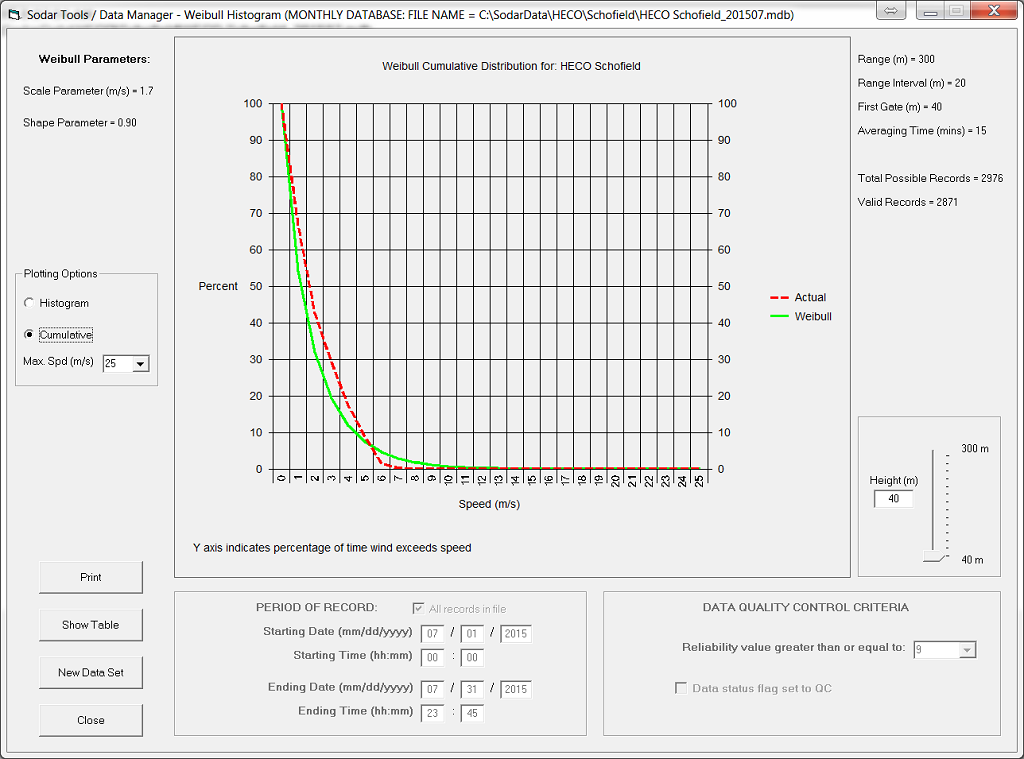
An example of the DataManager Weibull Plot Display is shown below. This function gives the user the capability to generate a histogram and a cumulative plot of wind data for a selected period. The height is selectable and a button is provided to display the underlying data table, which shows the actual percentages used to generate the graphics. The calculated Weibull scale and shape parameters are shown on the upper left of the display.

