office (808) 329-1627
DataManager Time Series Display
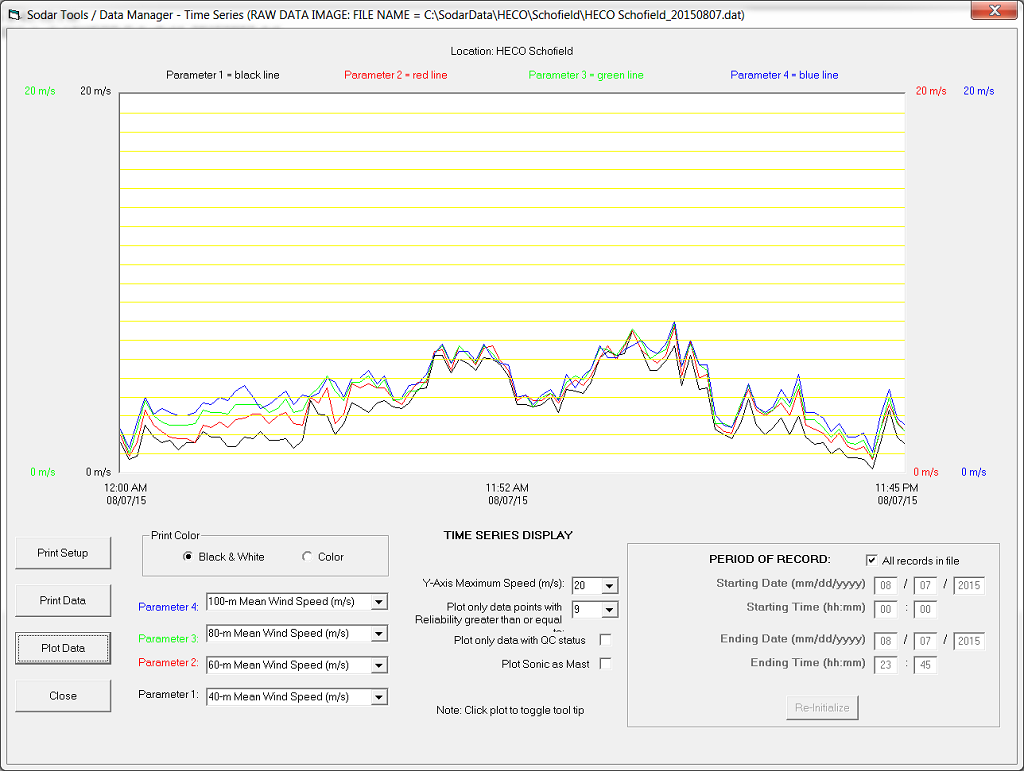
An example of the DataManager Time Series Display is shown below. The user can open a sodar data file and plot a time series for the selected period. This example shows a plot of one 24-hour time period. Up to four parameters, which are user selectable, can be plotted. The time series display can also be printed.