office (808) 329-1627
DataManager Profile Plots Display
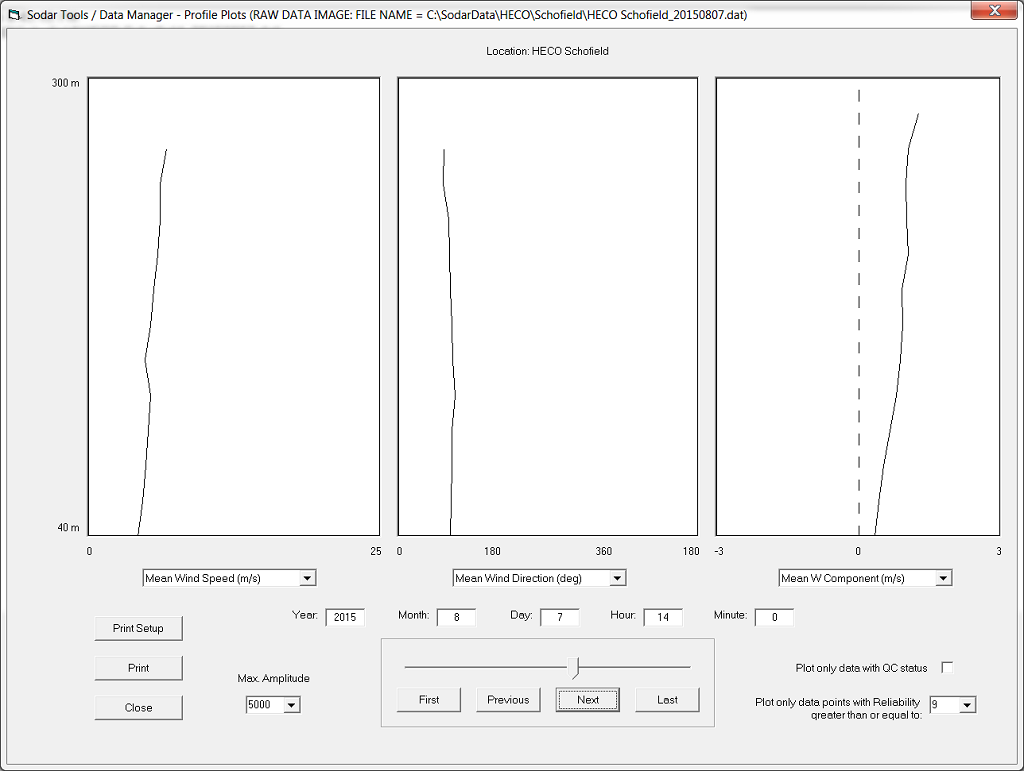
An example of the DataManager Profile Plots Display is shown below. The Profile Plots Dispaly is composed of three plotting areas, each one displaying data for one user-selected parameter. For each parameter, height is plotted on the vertical scale and the parameter value is plotted on the horizontal scale for a selected averaging period. Controls are provided to step through the data forward and backward. The display can also be printed.