office (808) 329-1627
PCSodar Profile Plots Display
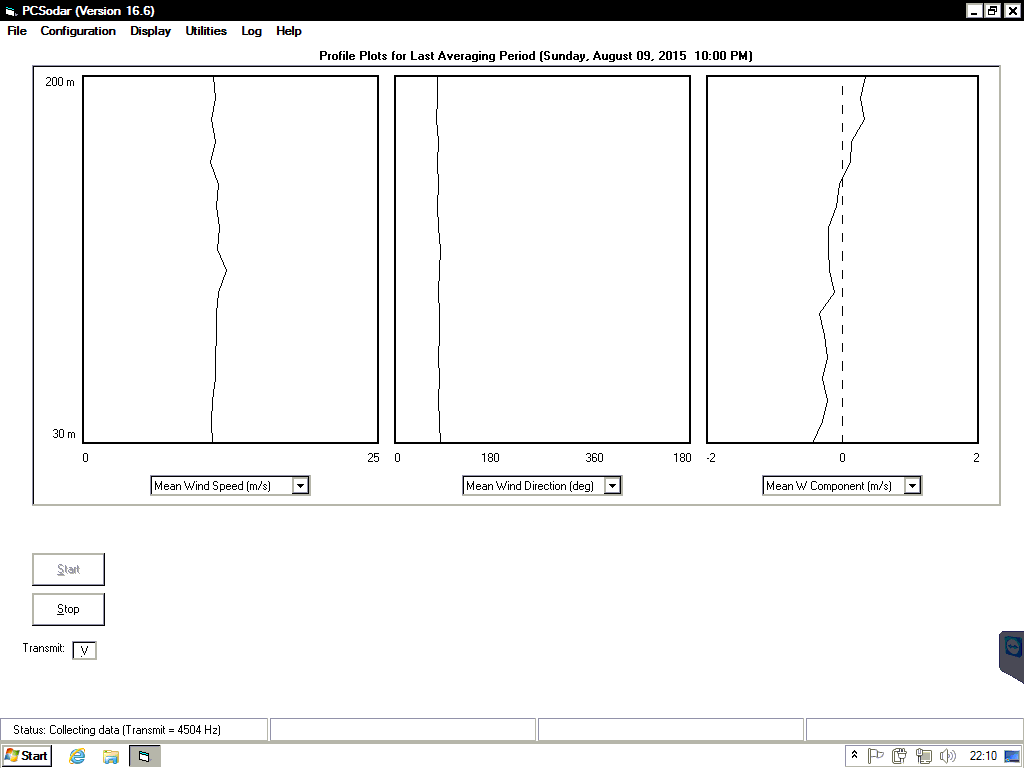
PCSodar's Plotted Data screen is composed of three plotting areas, each one displaying data for one user-selected parameter. For each parameter, height is plotted on the vertical scale and the parameter value is plotted on the horizontal scale. The plots are updated at the end of each averaging period. An example of this display is shown below.
