office (808) 329-1627
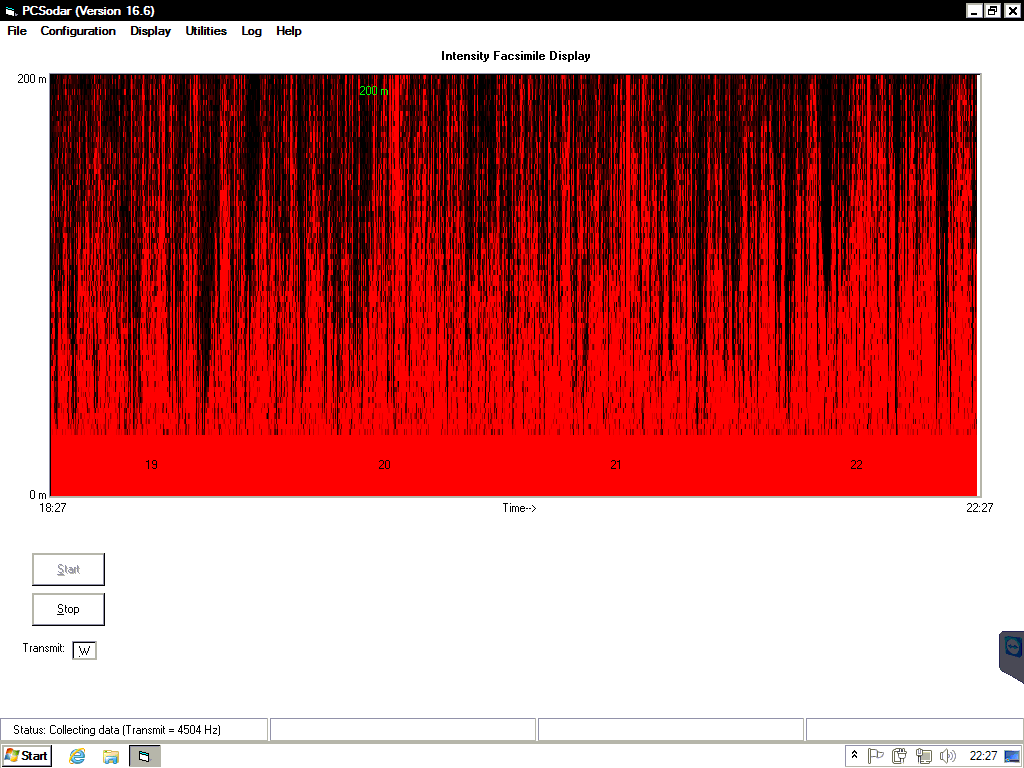
PCSodar Intensity Facsimile Display
This sample Intensity Facsimile display was generated by PCSodar between the hours of 1900 and 2200 GMT (which in this case was 0900 to 1200 local time). The time of day (in hours) is plotted on the horizontal scale and height is plotted on the vertical scale. Red areas represent high intensity; black areas represent low intensity. The Intensity Facsimile data are stored by PCSodar as bit-mapped images (.bmp files) which can be viewed and edited with most graphics software. The example shown here is a typical daytime shear-echo situation that is indicative of unstable atmospheric conditions. After sunrise at about 7 am, the intensity pattern begins to change to a thermal echo with relatively high intensities throughout the altitude range interspersed with periods of rapidly decreasing amplitude, which is characteristic of convective mixing conditions.
