office (808) 329-1627
PCSodar Initial Screen
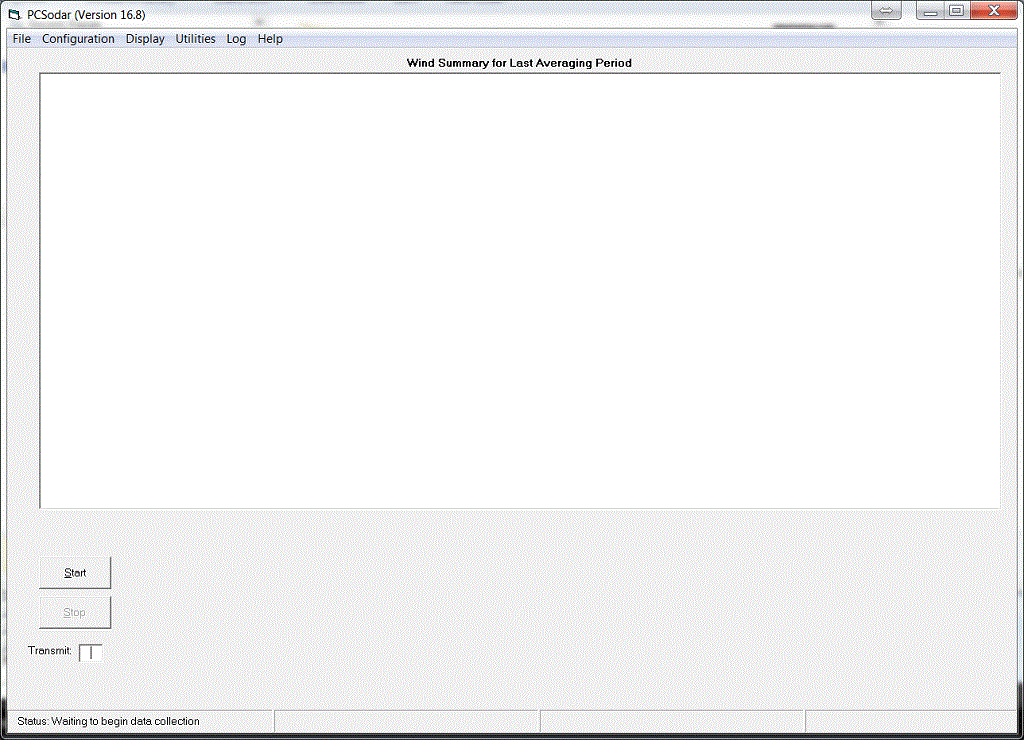
The graphic below shows an example of the screen that is displayed when PCSodar is first launched. Initially, a blank list box will be displayed. The list box can be used to view various data displays. During data collection, the Transmit text box in the lower left corner of the screen identifies the pulse (W, V or U) currently being transmitted and processed. At the end of each user-defined averaging period, the wind summary data for the most recent period can be displayed on the screen. Other display options are also available.
The default system configuration provided enables many users to begin collecting data simply by clicking the Start button. Many of the basic configuration settings, including the averaging period, can be modified by the user to accommodate varying situations.
