
office (808) 329-1627
Model VT-1 Sodar and Tower Comparison
Over the years, several studies have been done with sodar systems located adjacent to towers instrumented with anemometers. Comparisons of data from the two systems have generally been very favorable. During February 2003, ART conducted another such study by installing a Model VT-1 sodar system adjacent to a 54-m tower located near Puunene, Maui, Hawaii. The sodar was installed at a distance from the tower of approximately one tower height (54 m). Data were collected using 15-minute averages for a total of 13 days (approximately 1,250 averaging periods). The tower site is pictured below:

The tower site was situated in the middle of a sugarcane field in the valley between Maui's high mountains to the east and west. Redundant R.M. Young Wind Monitor AQ sensors were mounted on the tower at four levels: 10 m, 27 m, 41 m and 54 m. The sensors were moved up the tower and into place by means of an instrument elevator. The photo below shows a close up view of the tower with the sensors lowered for servicing.

The results of the comparison between sodar and tower measurements are displayed in several time series and scatter diagrams shown below. Note that the tower wind speeds were recorded as scalar (arithmetic averages), whereas the Model VT-1 sodar records vectors averages. Thus, wind speeds from the sodar can be expected to be slightly lower than those reported by the tower. Wind directions may also be slightly different due to the different averaging techniques.
WIND SPEED - TOWER 27 M VS. SODAR 30 M:

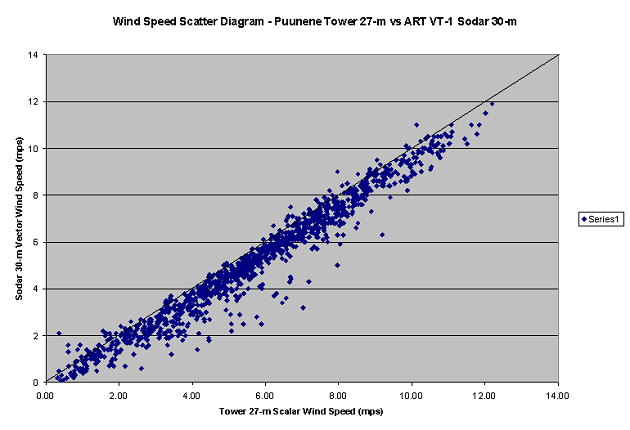
Correlation Coefficient = 0.98 Mean Difference (Sodar − Tower) = -0.6 mps
_________________________________________________________
WIND SPEED - TOWER 41 M VS. SODAR 40 M:

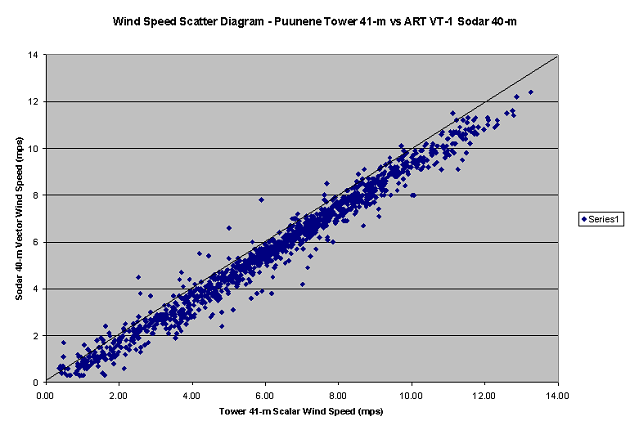
Correlation Coefficient = 0.99 Mean Difference (Sodar − Tower) = -0.6 mps
_________________________________________________________
WIND SPEED - TOWER 54 M VS. SODAR 50 M:

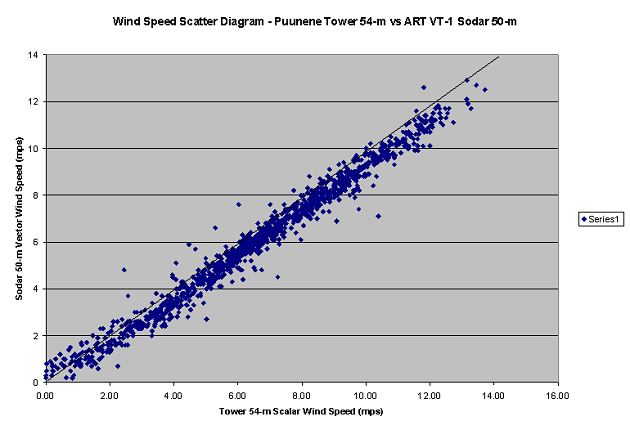
Correlation Coefficient = 0.99 Mean Difference (Sodar − Tower) = -0.6 mps
_________________________________________________________
WIND DIRECTION - TOWER 27 M VS. SODAR 30 M:
Note: Wind direction is plotted on a 540-degree scale to avoid crossover effects.

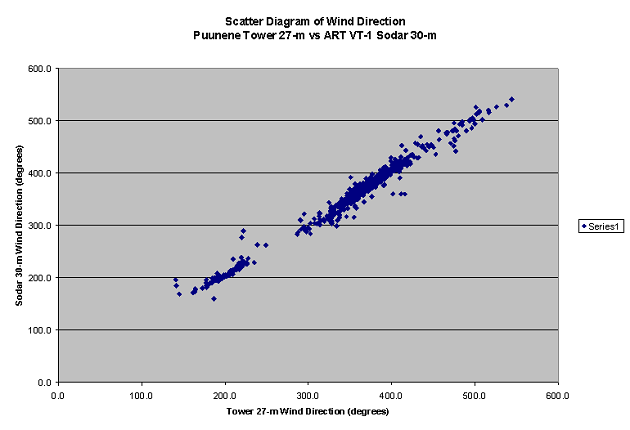
Note: Periods for wind speeds less than 1 mps as reported by the tower are excluded from the wind direction data.